Analysing ‘S Curves
August 25, 2022 2022-08-25 18:10Analysing ‘S Curves
Analysing ‘S Curves

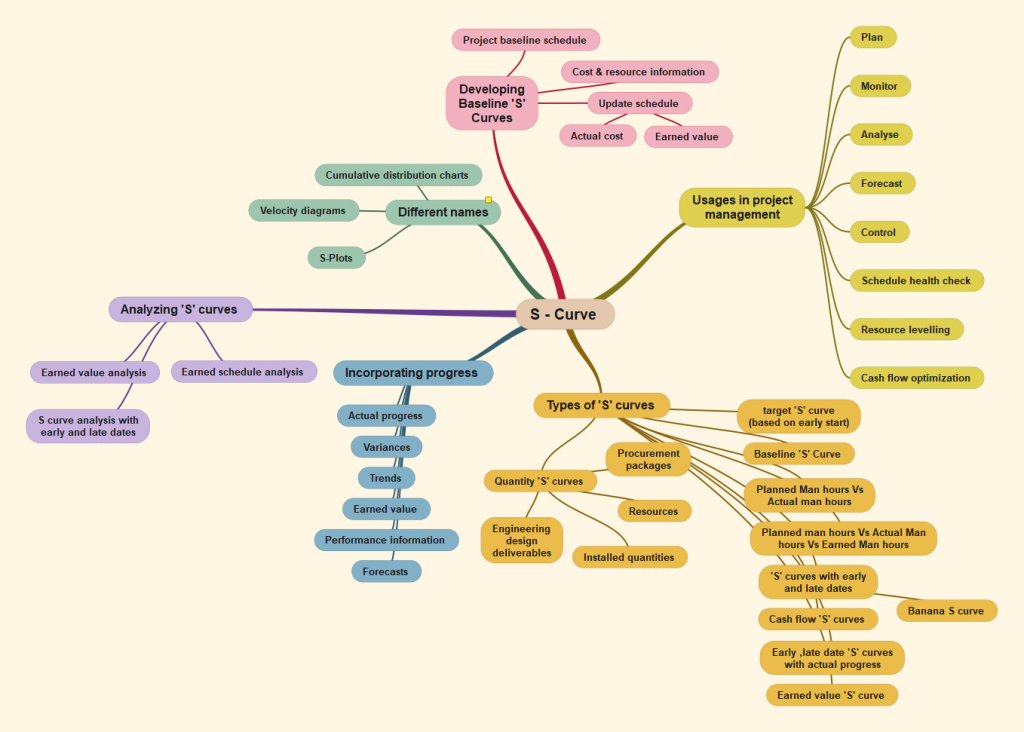
Contrary to the general belief that ‘S’ curves are used only for progress monitoring, modern project teams are using it for;
- Checking the health of schedules before baselining them
- Resource leveling
- Cashflow optimization
- Monitor progress against the baselines
- Analysisng slippages , constraints
- Controlling
- Forecasting expected completion and cost
Various types of ‘S’ Curves
- Quantity ‘S’ curves like;
- Engineering design deliverables
- Installed quantities
- Resources
- Procurement packages etc
- Target ‘S’ curve, based on the Early start dates
- Baseline ‘S’ curve
- Planned man hours Vs actual man hours Vs earned man hours
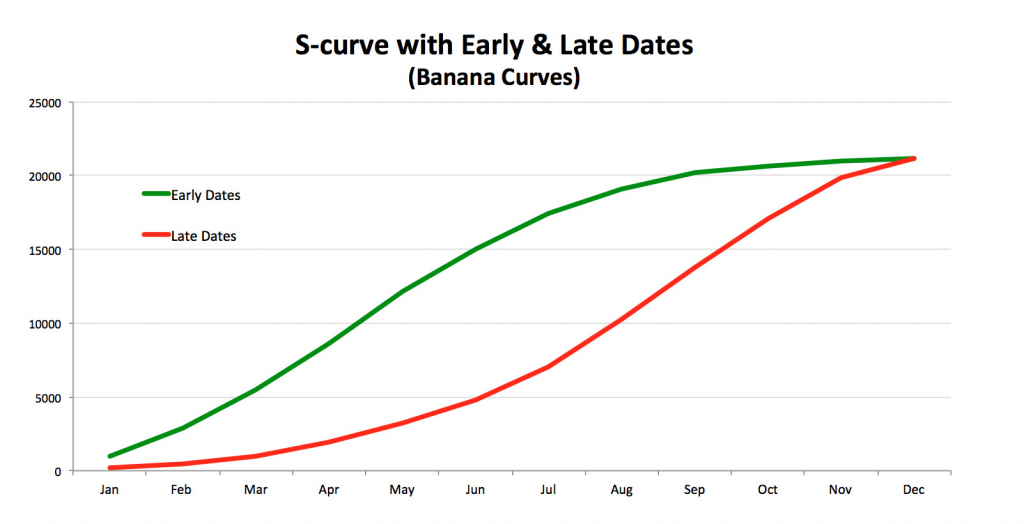
- ‘S’ curves with early and late start dates (banana ‘S’ curve)
- Early, Late date ‘S’ curves with actual progress
- Earned value ‘S’ curve

Incorporating progress
- Actual progress
- Variances
- Trends
- Earned value
- Performance information
- Forecasts
Analysing ‘S’ curves
- Earned value analysis
- Earned schedule analysis
- ‘S’ curve analysis with early and late dates
Key challenges
The most important aspect in progress monitoring using ‘S’ curves is the accurate and timely capture of actual progress and cost. This is happening mainly becuase of;
- Multiple stakeholders
- Distributed and diverse systems
- Lack of norms for updating the actual data with respect to time and measurement
These challenges can be eliminated by digital progress monitoring and control systems with automated workflows which allows for automatic capture of the actual progress. Capturing the actual cost is still a challenge.
References / Further reading
Earned Value Project Management Simplified
EVM progress monitoring using ‘S’ curves and histograms of engineering deliverables
Analyzing ‘S’ curves 55R-09 AACE

